Contents
Filamentary structure of the sea ice concentration
The filamentary structure of the main anomalies observed in the Arctic is parallel to the southern limit of the ice, which shows unequivocally that the melting or the glaciation are tightly controlled by the ocean. In Antarctica, the structure of the anomalies is more diffuse and more evanescent. Currently the anomalies disclose a very active replenishment of the ice, the acceleration of the phenomenon being due to the change in the albedo. In all cases, melting occurs primarily where sea ice is in contact with the antinodes of baroclinic quasi-stationary waves after they have merged with the North Atlantic drift current in the northern hemisphere or with the Antarctic circumpolar current in the Southern Hemisphere.
Satellite measurement of the concentration of sea ice by microwave provides relevant information on the temporal evolution of the polar ice: the amplitude of variations in the percentage of ice highlights the most impacted areas.
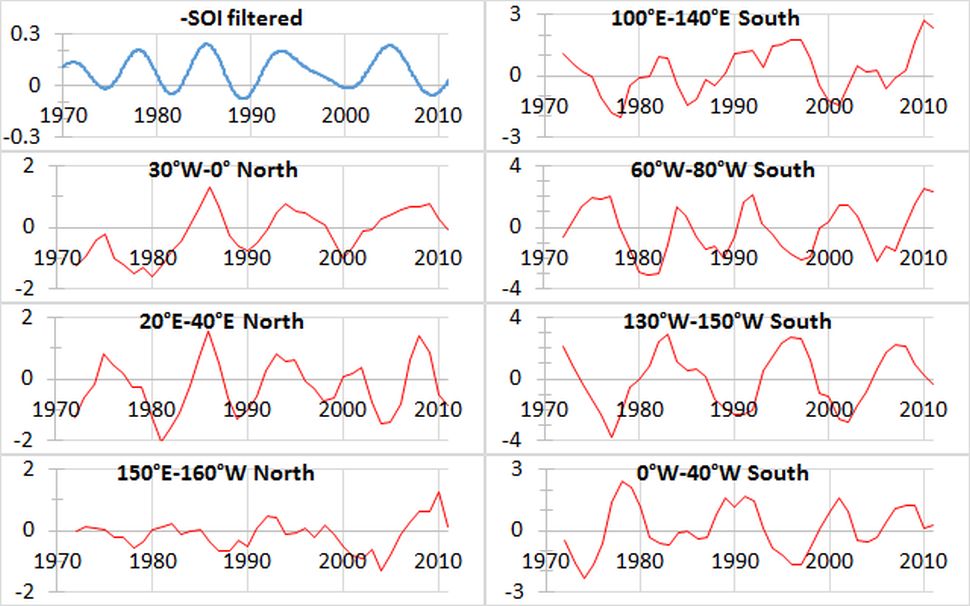
In Arctic major anomalies are located between longitudes 30 ° W-0 °, 20 ° E-40 ° E, 150 ° E-160 ° W, in Antarctica between 100 ° E-140 ° E, 60 ° W- 80 ° W, 130 ° W-150 ° W, 0 ° -40 ° W. The average sea ice percentage over the ice surface between these longitudes shows anomalies of periodic behavior whose period varies from 8 years in the Arctic between 20 and 40 ° E to 13 years in the Antarctica between 130 ° W and 150 ° W.
The northern hemisphere
The filamentary structure of the two main anomalies observed in the Arctic in the north of the Atlantic located between longitudes 30°W-0° and 20°E-40°E, is parallel to the southern limit of the ice, which shows unequivocally that the melting or on the contrary the reconstitution of ice over time is tightly controlled by the ocean. This finding suggests that the thermohaline circulation intervenes by imposing temperature conditions at the southern boundary of the ice, stimulating sea water advection below the surface of the pack ice (Polyakov et al., 2010, 2012).
The annual variations of sea ice percentage related to the anomaly 20°E-40°E are almost in opposite phase with respect to the signal SOI, and in phase with the northernmost thermal anomaly of the North Atlantic that is in contact with the ice.
The concentration of sea ice at the anomaly located between 30°W and 0°, though strongly correlated to the previous one, seems to have a period higher than 8 years. It also shows large variability reflecting specific transfer process at the Denmark Strait, with a significant melting episode during the 1970s and early 1980s when the sub-harmonic of 128-year average period of the sea surface temperature reaches its maximum.
In the North Pacific, melting is probably the result of the drift of the eastern thermal anomaly external to the gyre, which exerts its influence through the Bering Strait via the current of Alaska. At longitudes 150°E-160°W the ice is recovering since the mid-2000s.
The southern hemisphere
The structure of the anomalies observed in Antarctica is more diffuse and more evanescent than in the Arctic, probably because the thermohaline circulation is less active, which reduces sea water advection in the polar cap. Another reason cited for the Arctic responsiveness to climate change, which is revealed by the climate archives, is related to the position of Greenland which amplifies its effects in the Norwegian Sea. Melting of pack ice mainly occurs where the sea ice is in contact with antinodes of sub-harmonics after they merged with the Antarctic Circumpolar Current. But the period of the episodes of melting / freezing, of the order of 12-13 years, is higher than the period of 8 years of the sub-harmonic of gyral Rossby waves. This frequency shift could result from the dynamics of the ice and a sub-harmonic mode locking whose average period is 12 years (multiple of 4 years which is the average period of a sub-harmonic whose magnitude is significant at high latitudes). Anomalies at longitudes 100°E-140°E and 60°W-80°W currently show a very active reconstruction of ice, acceleration of the phenomenon being attributable to the change in albedo.
Glossary
The albedo, which is the ratio of solar energy reflected by a surface to the incident solar energy is high on the polar caps (about 60%) and much lower on the oceans (5-10%). For a period of cooling the polar caps extend, increasing the albedo. The planet reflects more solar radiation, absorbs less, which enhances cooling. Warming has the opposite effect: the global warming melts the polar ice, which reduces the albedo and thus increases the temperature of the planet.