The ENSO (El Niño Southern Oscillation) is among the most significant climatic phenomena on the planetary scale.
Contents
- The tropical Pacific Ocean
- Distribution of ENSO events
- Determine accurately the lag of ENSO events
- Characterization of ENSO events
- Weaknesses of current forecasting models
- Predictability of ENSO
- Impact of ENSO on climate
- Implementation of the prediction method
- Long-term evolution of ENSO
The tropical Pacific Ocean
During ENSO events, the tropical response of rain-producing cumulonimbus is critical because deep convection is the principal agent for exchanging heat (mainly latent heat) from the ocean’s surface to the free atmosphere. Atmospheric wave motions are excited as a response to the newly emerging tropical energy sources. The circulation of mass and energy in the atmosphere extends into the subtropics, while being deflected by the Coriolis force resulting from the rotation of the Earth.
Upwelling in the eastern Pacific may be strongly stimulated during the westward phase propagation of the quadrennial quasi-stationary wave (QSW). In this case the cold water that extends on the surface generates nonlinear processes leading to the amplification of easterlies during La Niña recovery. The cold ascending column reduces evaporation process, which causes an increase in atmospheric pressure and the resumption of trade winds, due to the strengthening of the Walker circulation and expansion of the Hadley cell. In the central Pacific the Rossby wave reinforces mixing of shallow water, which reduces the sea surface temperature and also reduces the evaporation process.
Thus the uprising of the thermocline during El Niño events, which accompanies the recession to the west of the quadrennial QSW, leads to the depletion of warm surface waters. Strengthening winds during La Niña reduces cloud cover in the tropical Pacific, which allows shortwave (visible sunlight) to warm the ocean. Thus, La Niña helps recharge the warm water pool in the Western Pacific. It is this mass of warm water, which is under a thermal barrier formed by a water layer of low density (less salty), which will arouse the following El Niño episode, transport to the central-eastern Pacific being performed by a Kelvin wave resulting from the coupling of the annual and quadrennial basin modes. The quadrennial sub-harmonic appears as self-sustained because forcing associated with El Niño and La Niña occurs during a critical phase of its evolution, which explains the high variability of its period in the absence of a periodic forcing external to El Niño (Pinault, 2015).
Distribution of ENSO events (Pinault, 2015, 2016, 2018b)
To be convinced of the leading role of the quadrennial QSW in the genesis and in the evolution of ENSO, just characterize the events based on the date they are mature. Indeed, both the upsurge and the decay phases of ENSO are closely related to their time lag that is represented relative to the central value of successive intervals of 4 years length, e.g. 01/1868 to 01/1872, 01/1872 to 01/1876…, 01/1996 to 01/2000…
Determine accurately the lag of ENSO events (Pinault, 2015, 2016, 2018b)
Two signals are widely used to characterize ENSO, the Southern Oscillation Index (SOI) and the Sea Surface Temperature (SST) anomaly between 5°N-5°S in latitude and 170°W-120°W in longitude (Nino 3.4 index) that has been proposed by Trenberth, 1997. To determine accurately the time of occurrence of ENSO, from which is deduced the lag, the signal has to be filtered with a low-pass filter to remove the noise and to prevent having too frequent events.
The SST anomaly in the central-eastern Pacific results from both the strip closest to the equator in the northern hemisphere of the annual QSW and the central-eastern antinode of the quadrennial QSW. So the SST anomaly primarily results from the annual QSW. When an El Niño event is occurring the SST anomaly reflecting the eastward phase propagation of the quadrennial QSW follows the anomaly related to the annual QSW. Indeed, supposing the geostrophic forces of the tropical basin permit, a Kelvin wave is formed in the most western part of the basin as soon as the modulated current of the North Equatorial Counter Current (NECC), which is a node of both the annual and the quadrennial QSWs, accelerates while approaching the equator. The fast eastward propagation of the Kelvin wave causes the SST anomaly related to the quadrennial QSW follows the anomaly related to the annual QSW, which produces a single unresolved peak. Thus, the peaks characterizing such events are recognizable by their width, but filtering of the signal has no sense.
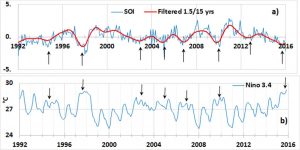
Characterization of ENSO events according to their lag determined from the date of occurrence of the minima of SOI filtered in the band 1.5/15 yrs (Pinault, 2016, 2018b)
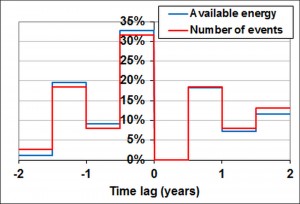
By choosing a cutoff frequency of SOI in order to select the 38 most significant events observed between 1866 and 2016, the distribution of the events versus their lag is represented in Table 1. They are very unevenly distributed. But the highest frequencies correspond to the lags -1.5,-1 yr, -0.5, 0 yr, 0.5, 1 yr and 1.5, 2 yr, which suggests a strong interaction between the annual and quadrennial QSWs. Thus 34 % of the events are in phase with the annual QSW (they occur between July and December when the eastward velocity of the modulated current at the southern node of the annual QSW reaches its maximum) while being unlagged. 34 % of the events are in phase with the annual QSW while being weakly lagged, 11% are in phase with the annual QSW while being strongly lagged and 21% are out of phase with the annual QSW. Such events are necessarily lagged since no event occurs in the interval 0, 0.5 yr.
The dynamics of the quadrennial QSW according to the lag and to its phase with the annual QSW is illustrated in the following three videos. The first represents an unlagged event, the second a weakly lagged event in phase with the annual QSW, the third an event out of phase with the annual QSW.
Weaknesses of current forecasting models
Whether they are dynamical or statistical, current models use information from the deepening of the thermocline along the equator. But this one is biased due to the superposition of annual and quadrennial Quasi-Stationary Waves (QSWs). However, only the quadrennial QSW should be involved in the prediction of ENSO: the results obtained are therefore vitiated by significant systematic and random errors.
On the other hand, the characterization of warm ENSO events from SST, as practiced very widely since the work of Trenberth, 1997, is almost inextricable because of the extreme complexity of exchanges at the ocean-atmosphere interface, making each El Niño event having a unique signature in the SST lifecycle. It is more appropriate to characterize the ENSO from the fall of the Southern Oscillation Index (SOI) which indicates the maturation phase without any ambiguity. Consequently, the question of the atmosphere’s sensitivity to such inter El Niño variations of the SST is not essential except for anticipating the impact of ENSO locally (e.g. Davey et al., 2014) in which case its predictability closely depends on the time lag of the event (Pinault, 2016).
Predictability of ENSO (Pinault, 2018b)
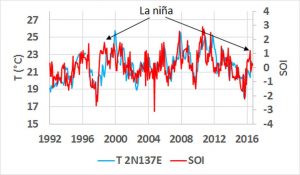
Compare the mean subsurface water temperature measured between 100 and 200 m in depth at 2 ° N 137 ° E to the Southern Oscillation Index (SOI). Excluding the two periods marked by the resumption of La Niña following the El Niño events mature in 11/1997 and 09/2015, the SOI’s signature is reflected very faithfully and in every detail by the subsurface water temperature in the westernmost part of the equatorial Pacific.
These observations suggest that the discharge of the warm water pool of the tropical Pacific in its western part and the transfer of warm water to the east induce a straightforward ocean-atmosphere interaction. In other words, given the linearity of the interaction, the warm water is entirely involved in the evaporative processes controlling the Walker circulation, whatever the amplitude and the time of occurrence of the resulting ENSO. The only deviation from this causal relationship of incredible simplicity appears when upwelling in the eastern Pacific is strongly stimulated during the westward phase propagation of the quadrennial Quasi-Stationary Wave (QSW) so that the cold water that extends on the surface generates non-linear processes leading to La Niña.
The quadrennial QSW shares the tropical Pacific into western and eastern antinodes, both of them being nearly in opposite phase. The western antinodes result from off-equatorial Rossby waves. They have a warm water storage function. The subsurface water temperature at 2 ° N 137 ° E reflects the discharge of this reservoir, i.e. the gradual replacement of warm water with cold water as warm water is transferred to the east. On the other hand, the subsurface water temperature at the central-eastern antinode, which produces ENSO, reflects the recharge of the latter.
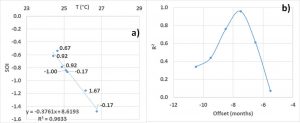
At the longitude 180°W, i.e. at the most westerly tip of the equatorial central-eastern antinode, the subsurface water temperature anomalies precede by 8-7 months the maturation phase of ENSO. That is the limit beyond which it is theoretically impossible to predict ENSO from direct observations because the central-eastern antinode vanishes west of 180°W. But along the equator the southernmost antinode, situated in the northern hemisphere, of the annual QSW is also perceptible. Resonantly forced by easterlies, this QSW has a large amplitude in the northern hemisphere, exhibiting two antinodes nearly parallel to the equator, around 8-10 ° N and 0-4 ° N. Contrariwise, the two antinodes located in the southern hemisphere display a weaker amplitude, with the exception of their western part. The peaks in subsurface water temperature at 2 ° S 180 ° W show the contribution of the quadrennial QSW is enhanced to the detriment of the annual QSW. Indeed, the central-eastern antinode of the quadrennial QSW that generates the ENSO, as for it, is symmetrical with respect to the equator. Furthermore, the peaks either reflect the annual or the quadrennial QSW distinctly, without any interference.
The correlation between the minimum SOI and the monthly subsurface water temperature at 2 ° S 180 ° W averaged over 125 to 175 m in depth (data are interpolated between 150 and 200 m), 8 to 7 months prior to the minimum SOI, indicates that the coefficient of determination is 0.96. This reflects both the strong coherency between that temperature T and the minimum SOI, and the accuracy of measurements when the SOI is filtered within the band 1.5/15 years. To show the merits of the method, filtering of the SOI signal is essential to reduce the noise in order to highlight the amplitude and the location of the successive minima that characterize the ENSO events.

Impact of ENSO on climate
In the tropics, heat transfer from the Pacific Ocean to the atmosphere produces quasi-geostrophic motion of the atmosphere. From the heating zone are formed equatorial-trapped eastward Kelvin waves and westward Rossby waves, hence easterly trade winds set up by atmospheric Kelvin waves to the east and westerlies as an atmospheric planetary wave response to the west.
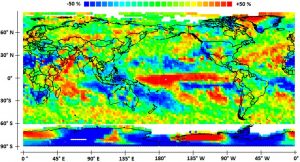
Impact of ENSO can be evidenced from the variability of precipitation height, as are the equatorial atmospheric baroclinic waves. The latter are forced by deep convection to the troposphere that is enhanced over very warm sea surfaces in the tropics. These inertial waves, which arise from the difference in density between the lower and upper layers of the atmosphere, result in the oscillation of the upper layers of the troposphere. The baroclinic wave modes do vary in the vertical. They alternatively induce precipitations or drier conditions depending on the lapse rate, that is, the altitude of warm and wet layers in the upper troposphere.
An important cause of variability of ENSO events is the time lag. This parameter reflects how the eastward phase propagation of the quadrennial QSW occurs in the central-eastern Pacific. Four types of events can be characterized by the lag according to whether they are unlagged, weakly or strongly lagged, or out of phase with the annual QSW. Actually, unlagged and weakly lagged events behave in a similar way. The number of these observed events is not sufficient to highlight any specific features pertaining exclusively to their time lag. So only three types of events are the subject of a comparative study of their impact according to whether they are 1) unlagged or weakly lagged 2) strongly lagged or 3) out of phase with the annual QSW.
Implementation of the prediction method
Virtually, the prediction of warm events can be performed as soon as the monthly subsurface water temperature at 2 ° S 180 ° W averaged over 125 to 175 m in depth reaches a maximum. However, although attenuated, the peaks corresponding to the annual QSW have to be distinguished from the peaks resulting from the eastward phase propagation of the quadrennial QSW. Only the latter anticipate ENSO events. No clue allows distinguishing the different peaks of the subsurface water temperature unless the latter is compared to that of the subsurface water at both ends of the western antinode of the quadrennial QSW. These are the geostrophic forces at the tropical basin scale that cause Kelvin waves to be generated from off-equatorial Rossby waves in the extreme western Pacific, or not. In particular these forces are governed by the tilt along the equator of the sea surface height.
The peaks of subsurface water temperature at 2 °S 180 ° W resulting from the annual and quadrennial QSWs do not overlap, which explains the simple linear relationship of the pairs T-SOI. This suggests that the southernmost antinode of the annual QSW located in the northern hemisphere deviates from the path of the quadrennial QSW while the eastward phase propagation of the latter is occurring and the central-eastern antinode is growing.
As concerns the cold events, the amplification of La Niña can be seen a few months before the maturation phase of the ENSO event, as happened in 1998 and 2016, when the subsurface water temperature drops. Such temperature falling observed at the beginning of the westward phase propagation of the quadrennial QSW is a harbinger of upwelling amplification in the eastern Pacific and the development of a high atmospheric pressure system.
Long-term evolution of ENSO (Pinault, 2021a)
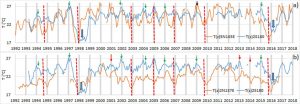
In Figure a, the standard deviation of the Nino3.4 index in the 1.5-7 years band is represented since 1870 with the global temperature in the northern hemisphere filtered in the 48-96 years band characteristic of the subharmonic mode n1 (T=64 years). This global temperature freed from its anthropogenic component is obtained from a linear combination of SST anomalies since 1870 averaged over particular areas at high latitudes of subtropical gyres. The mode n1 is considered as a pure harmonic of higher modes.

The negative correlation between the amplitude of ENSO and that of the North Pacific GRWs means that geostrophic forces act on the NECC to enable reduction of the ENSO activity when the modulated polar current of the North Pacific subtropical gyre accelerates while being anticyclonic. Indeed, the North Equatorial Current (NEC) at the lowest latitudes of the North Pacific gyre accelerates as it flows west. Thus, the geostrophic forces that drive the NEC are opposed to the NECC as it flows east. Jointly, weakening of the modulated component of the NECC induces a weakening of the modulated component of the South Equatorial Current (SEC), which is a driver of the quadrennial QSW, both modulated currents being at the nodes of the annual QSW. Belonging to a single dynamical system, they are correlated while flowing in opposite direction. Consequently, interaction of the North Pacific subtropical gyre at its lowest latitudes with the NECC may weaken the amplitude of the quadrennial QSW at the origin of ENSO. By contrast, the South Pacific gyre does not seem to have a significant influence on the long-term evolution of ENSO.
Conversely, the low amplitude of the variation in global temperature as occurs for the subharmonic mode n2 (T=128 years) in the 96-150 years band (the upper limit is fixed by the length of the series) induces a quasi-stationary state of ENSO activity in this same band (Figure b). This highlights the selective dynamics of the adjustment of geostrophic forces between the North Pacific gyre and the equatorial Pacific.
Using proxies of Nino3.4 index, a decline in ENSO activity during the Holocene and an increase during the Last Glacial Maximum are highlighted.
References
Davey M.K., A. Brookshaw and S. Ineson (2014) The probability of the impact of ENSO on precipitation and near-surface temperature, Climate Risk Management 1, 5–24
Trenberth, K., 1997: The definition of El Nino. Bull. Amer. Meteorological. Soc., 78, 2771-2777.
Glossary
Deep atmospheric convection mainly occurs in tropical regions where it forms the ascending column of the Hadley circulation. It results from a strong coupling between the surface and the upper atmosphere.
The latent heat is heat-exchanged in the change of state of the seawater during the process of vaporization.
At the equator, the heat provided by the sun warms the air near the surface. This air rises into the atmosphere and this upward movement leads to the creation of an area of low pressure. Air is sucked into this low pressure area, resulting in the trade winds in the two hemispheres.
SOI (Southern Oscillation Index)
The SOI is the amplitude of the Southern Oscillation; it is a measure of the monthly change in the normalized atmospheric pressure difference at sea level between Tahiti and Darwin (Australia).
Upwelling. Here, this term indicates an upward flow of deep water, therefore cold. The upwelling is associated with the functioning of tropical resonant waves.
The Coriolis parameter f is equal to twice the speed of rotation Ω of the earth multiplied by the sine of the latitude φ: f = 2Ωsin φ. The Coriolis force, on the other hand, is perpendicular to the direction of movement of the moving body. It is proportional to the velocity of the body and the speed of rotation of the medium.
The Walker Circulation, El Niño, La Niña. In the tropics, the direct airflow on the surface towards the equator (called Hadley cell) forms the inter-tropical convergence zone. The Coriolis force is small at these latitudes but enough to divert to the west the circulation, giving the trade winds (north-east in the northern hemisphere and south -east in the south). The Humboldt Current from Antarctica cools the coast of South America. So there is a large temperature difference between the western and eastern Pacific that leads to direct circulation similar to Hadley circulation (air masses rise close to Asia and Australia and down along the coast of South America). If convective activity decreases in the western Pacific, the eastward aloft flow decreases or stops, cutting cold air intake in the eastern Pacific and the return surface flow weakens. The opposite of El Niño is La Niña. Convection in the western Pacific increases in this case which amplifies cell Walker bringing colder air along the coast of America.
