As observed during the Holocene, the temperature of the earth’s surface is subject to the resonance of gyral Rossby waves that results from solar and orbital forcing. From this follows the resonant nature of the climate system. The forcing is all the more efficient as its period is closer to one of the resonance periods, the latter being locked in subharmonic mode (Pinault, 2018d, 2020a, 2021a).
During the glacial-interglacial era, climatic variations, which can be observed from the analysis of ice and sediment cores, occur mainly in four frequency bands.
Contents
Ice core records
The amplitude of the orbital variations of insolation and the global mean temperature estimated from EPICA [Augustin et al., 2004, Jouzel et al., 2007] shows the coupling mainly occurs into two bands centered on 41 Kyr (obliquity) and 100 Kyr (eccentricity) [Pinault, 2018d].
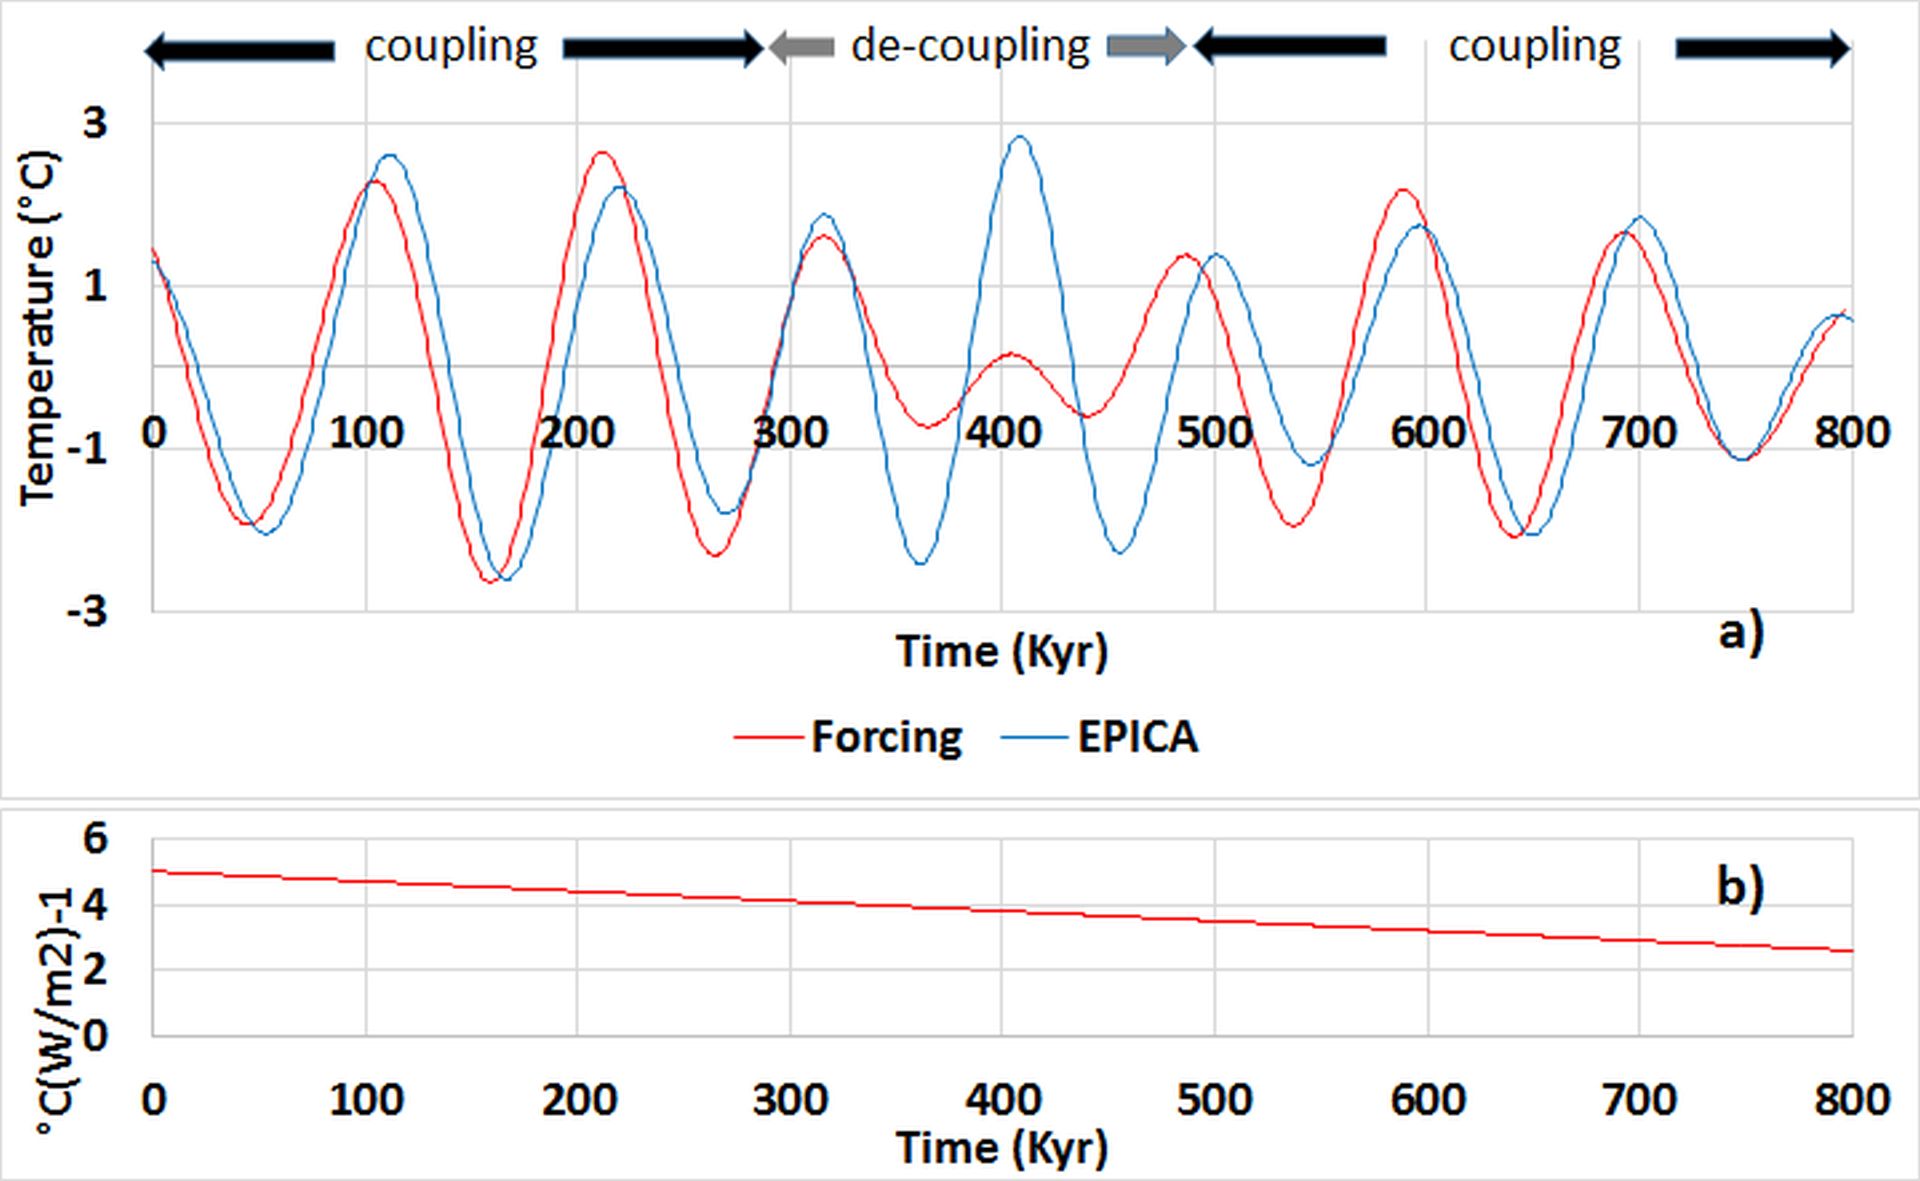
Concerning the eccentricity, the efficiency of forcing varies significantly during the 800 Kyr of observation, gradually increasing from 2.6 to 5.0 °C(W/m2)-1. Coupling relaxes between 450 and 350 Kyr BP when forcing collapses, and then recovers when the amplitude of forcing increases again. The stability of the oscillation of the gyral Rossby wave, which continues even when the forcing vanishes owing to the remanence of large-scale geostrophic forces, suggests it is the fundamental wave for the large periods, i.e. the wave whose amplitude is directly subject to the influence of orbital forcing. The increase in efficiency of forcing reflects that the period of orbital forcing and the natural period of gyral Rossby waves become closer over time.

This fundamental wave produces two harmonics whose natural periods are 49.2 and 24.6 Kyr, both shifting to the period of forcing related to the obliquity and the precession as a result of the drift of the latitude of centroids. The harmonic related to the obliquity undergoes instabilities disclosed by the variations in the efficiency of orbital forcing.
This confirms that the latitude of the component of 49.2 Kyr period does not differ from 2°30’ of that of the gyre steadily, but oscillates around its central value, the maximum efficiency being reached when the component merges with the gyre. Indeed, the successive advance and retreat of the polar front cannot be invoked to explain the sudden changes in the amplitude of the two harmonics because the dynamics of the polar pack is much faster than what is observed here, from what we have seen during the Holocene: a few thousand years versus nearly 50 Kyr.
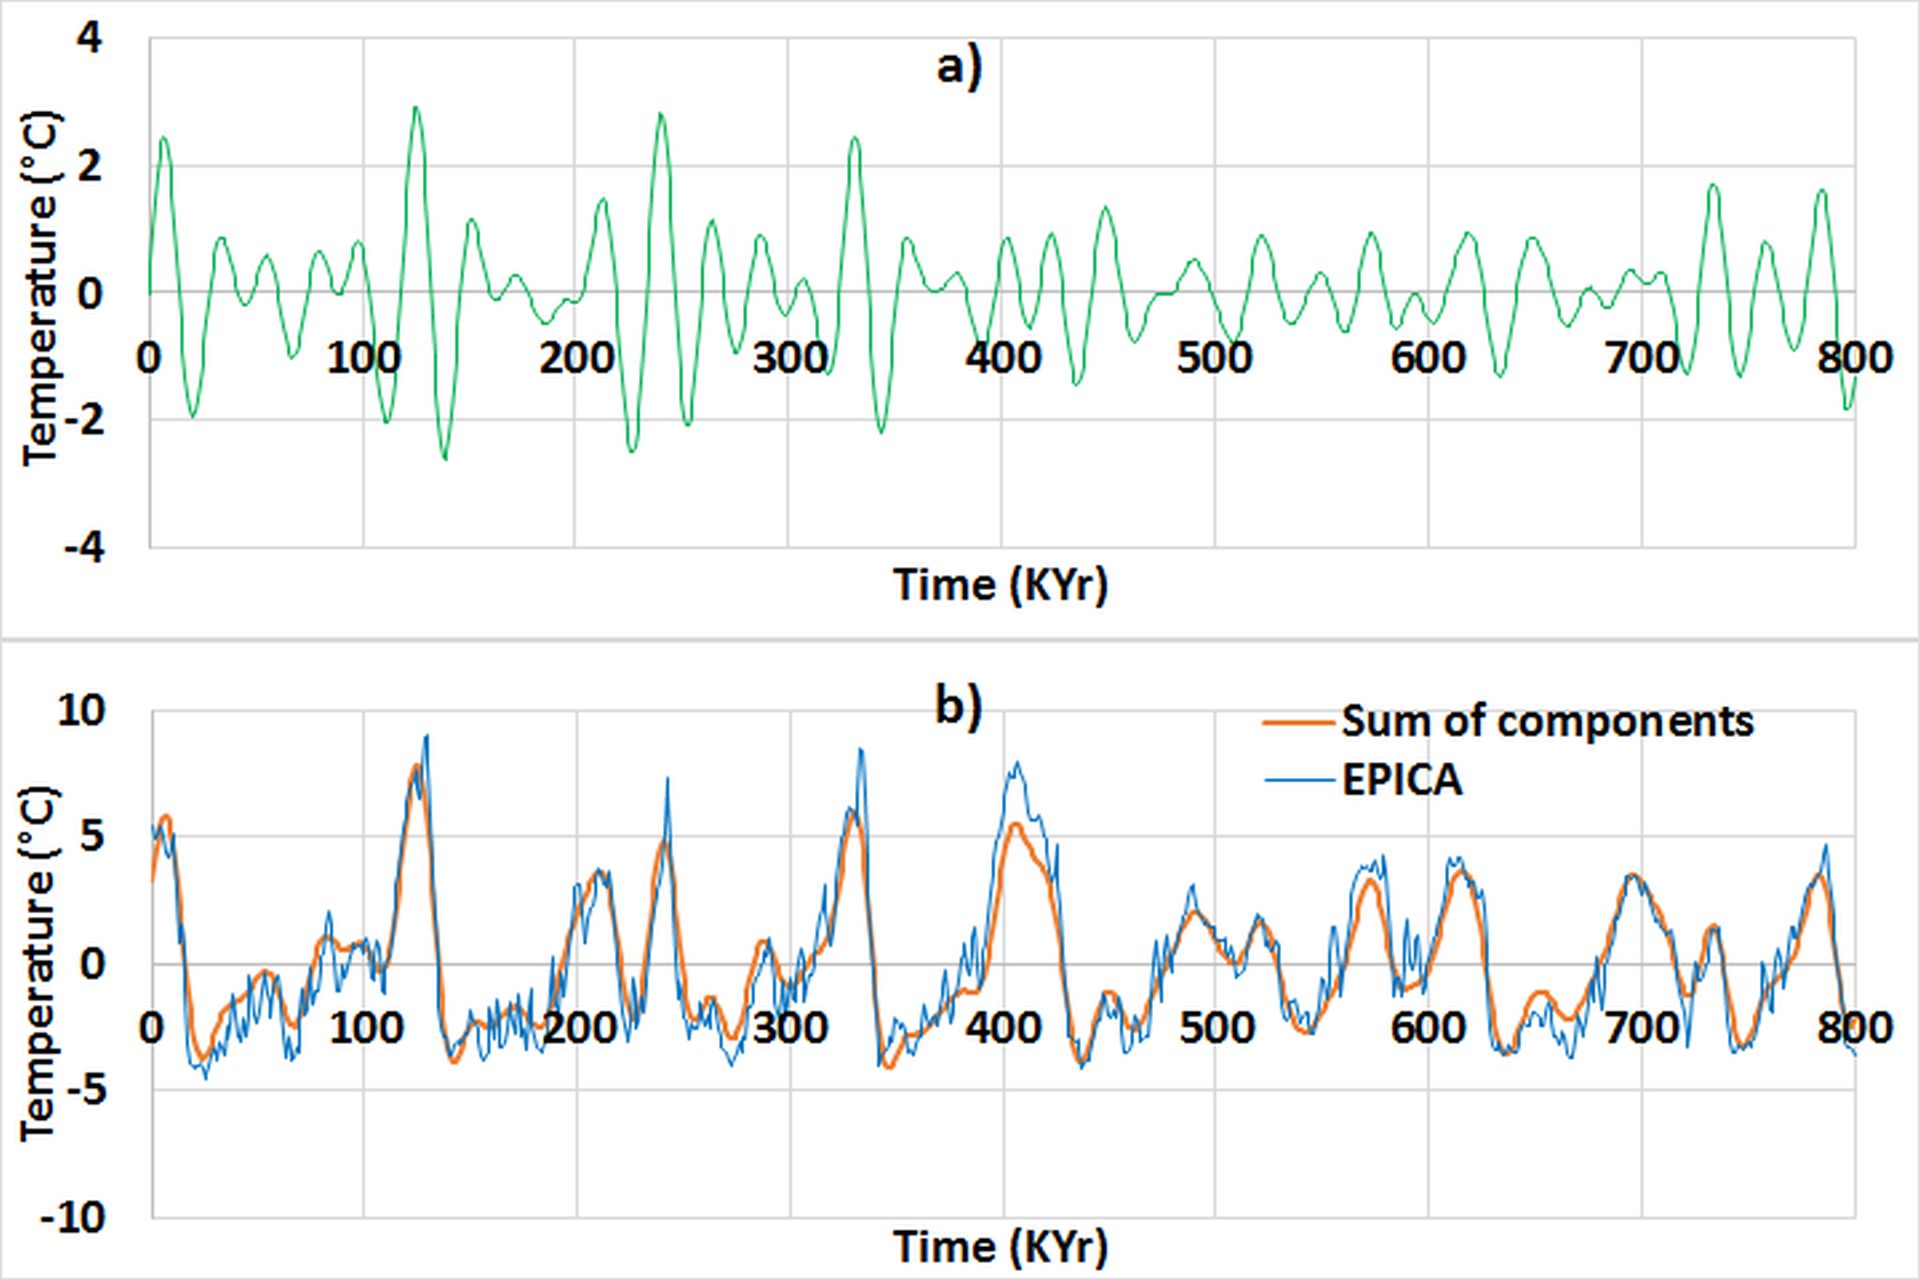
The orbital variations related to the precession, although low, force the gyral Rossby wave of 24.6-Kyr period. The forcing efficiency is subject to strong variations in amplitude, in relation with the phase of the fundamental wave as occurs 451, 332, 242, 127, 9 Kyr BP: the maximum amplitudes are reached when the fundamental wave is growing.
It appears that the component of 393.2 Kyr period is not coupled with the oscillation of eccentricity of 400 Kyr period, although more intense than that of 100 Kyr period. The only plausible reason seems to result from the deviation between both periods, more than 30 Kyr at present. Finally, the sum of the three components explain quite well the global mean temperature of the glacial–interglacial period over the 800 Kyr of observation.
Sediment core records
Sediment core records [Lisiecki and Raymo, 2005] allows elucidating what occurred 0.8 Myr (Myr=106 years) ago when the dominant period of the global mean temperature skipped from 41 to 100 Kyr. Indeed, when the temperature is calibrated relative to ice core records, the sediment records can be used in a quantitative manner over the period 0 to 2 Myr BP during which processes of diffusion that tend to blur the proxy used for the estimation of temperature changes, i.e. δ18O in foraminifera, can be neglected.
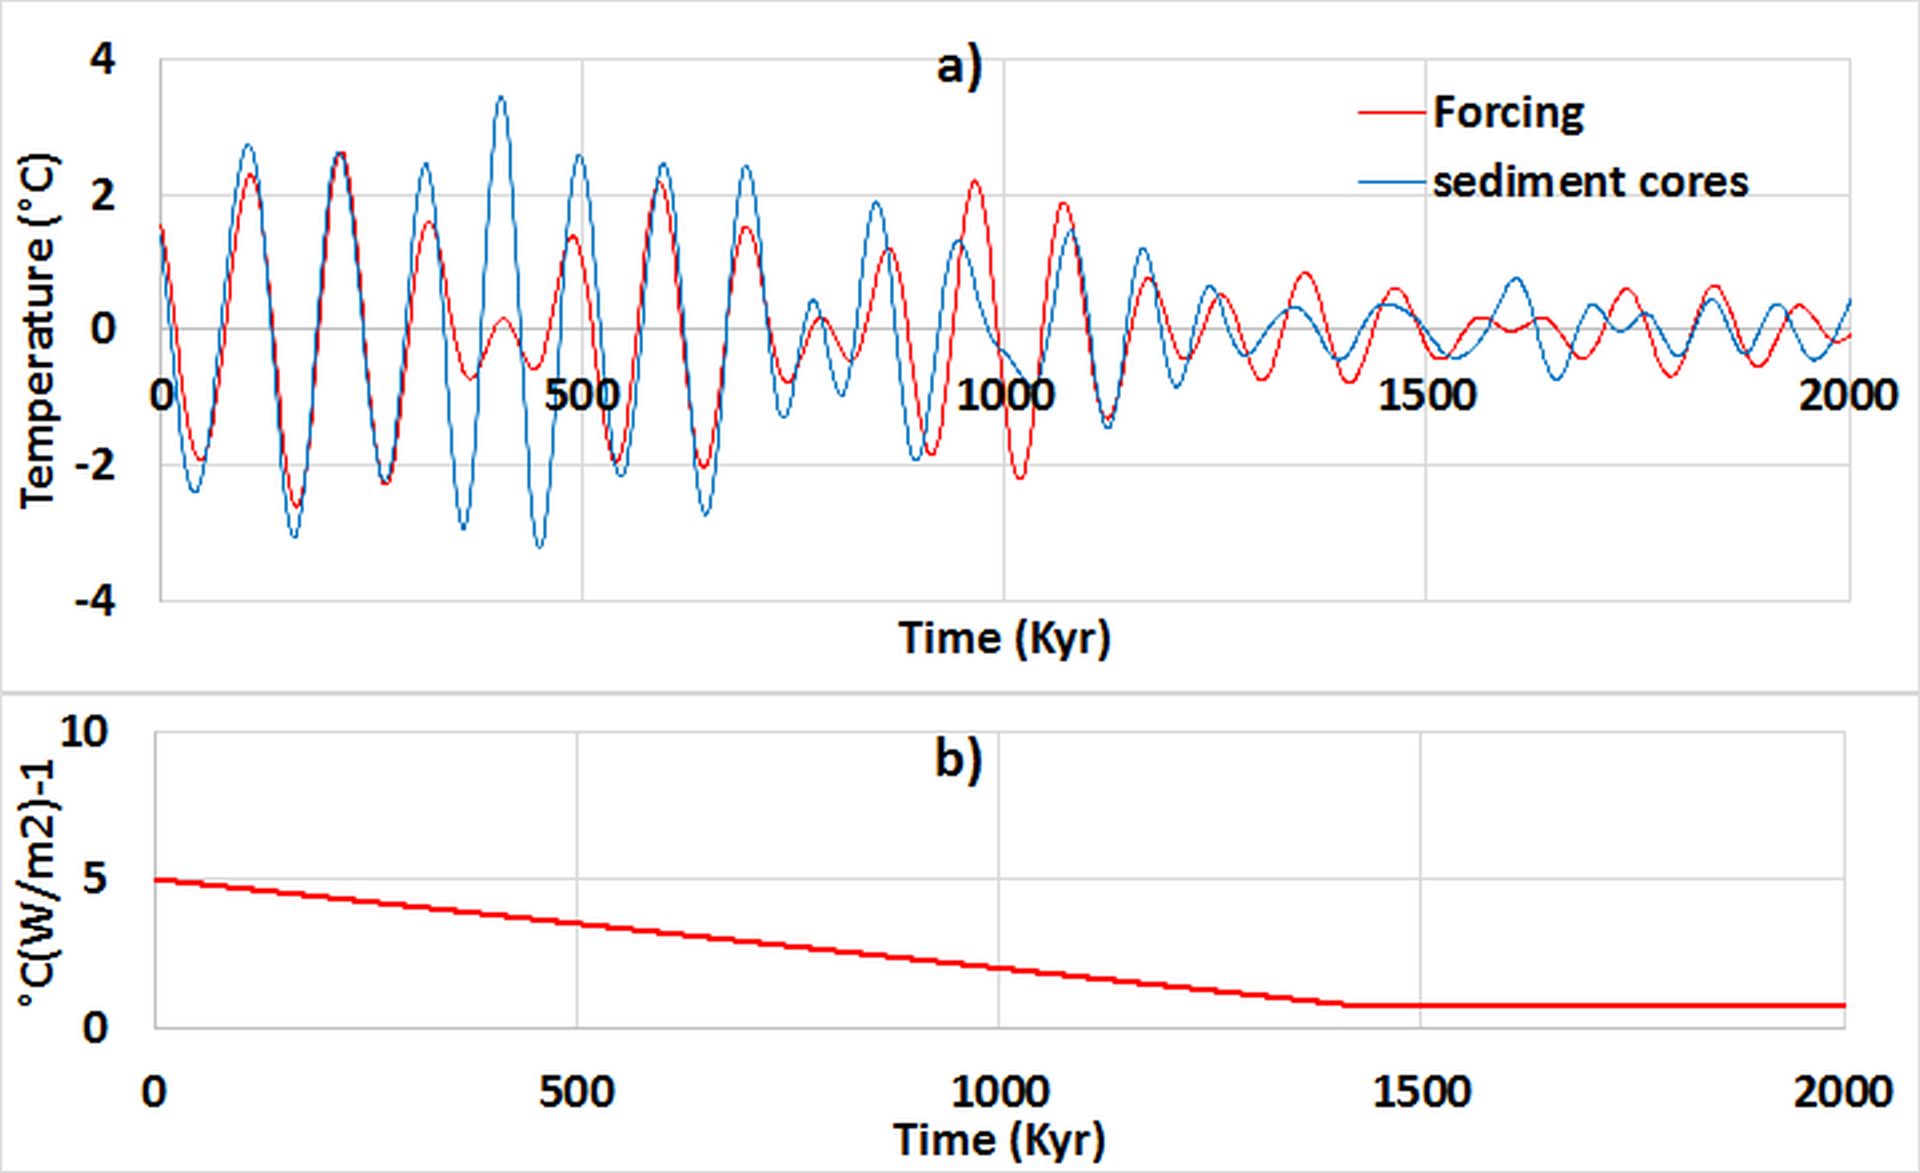
Both figures confirm what was observed in ice core records: the orbital forcing of gyral Rossby waves increases linearly since 1425 Kyr BP for eccentricity whereas it is subject to rapid variations for the obliquity. Although the evolution of the period of eccentricity can hardly be detected accurately from the wavelet analysis, which widens the frequency band of series obtained by Berger, 1992, it can be inferred that it is connected to the period of forcing approaching the natural period of gyral Rossby waves, i.e. 98.3 Kyr. Tuning between orbital forcing and gyral Rossby waves appears to be extremely sharp due to the narrowness of the frequency band of eccentricity.
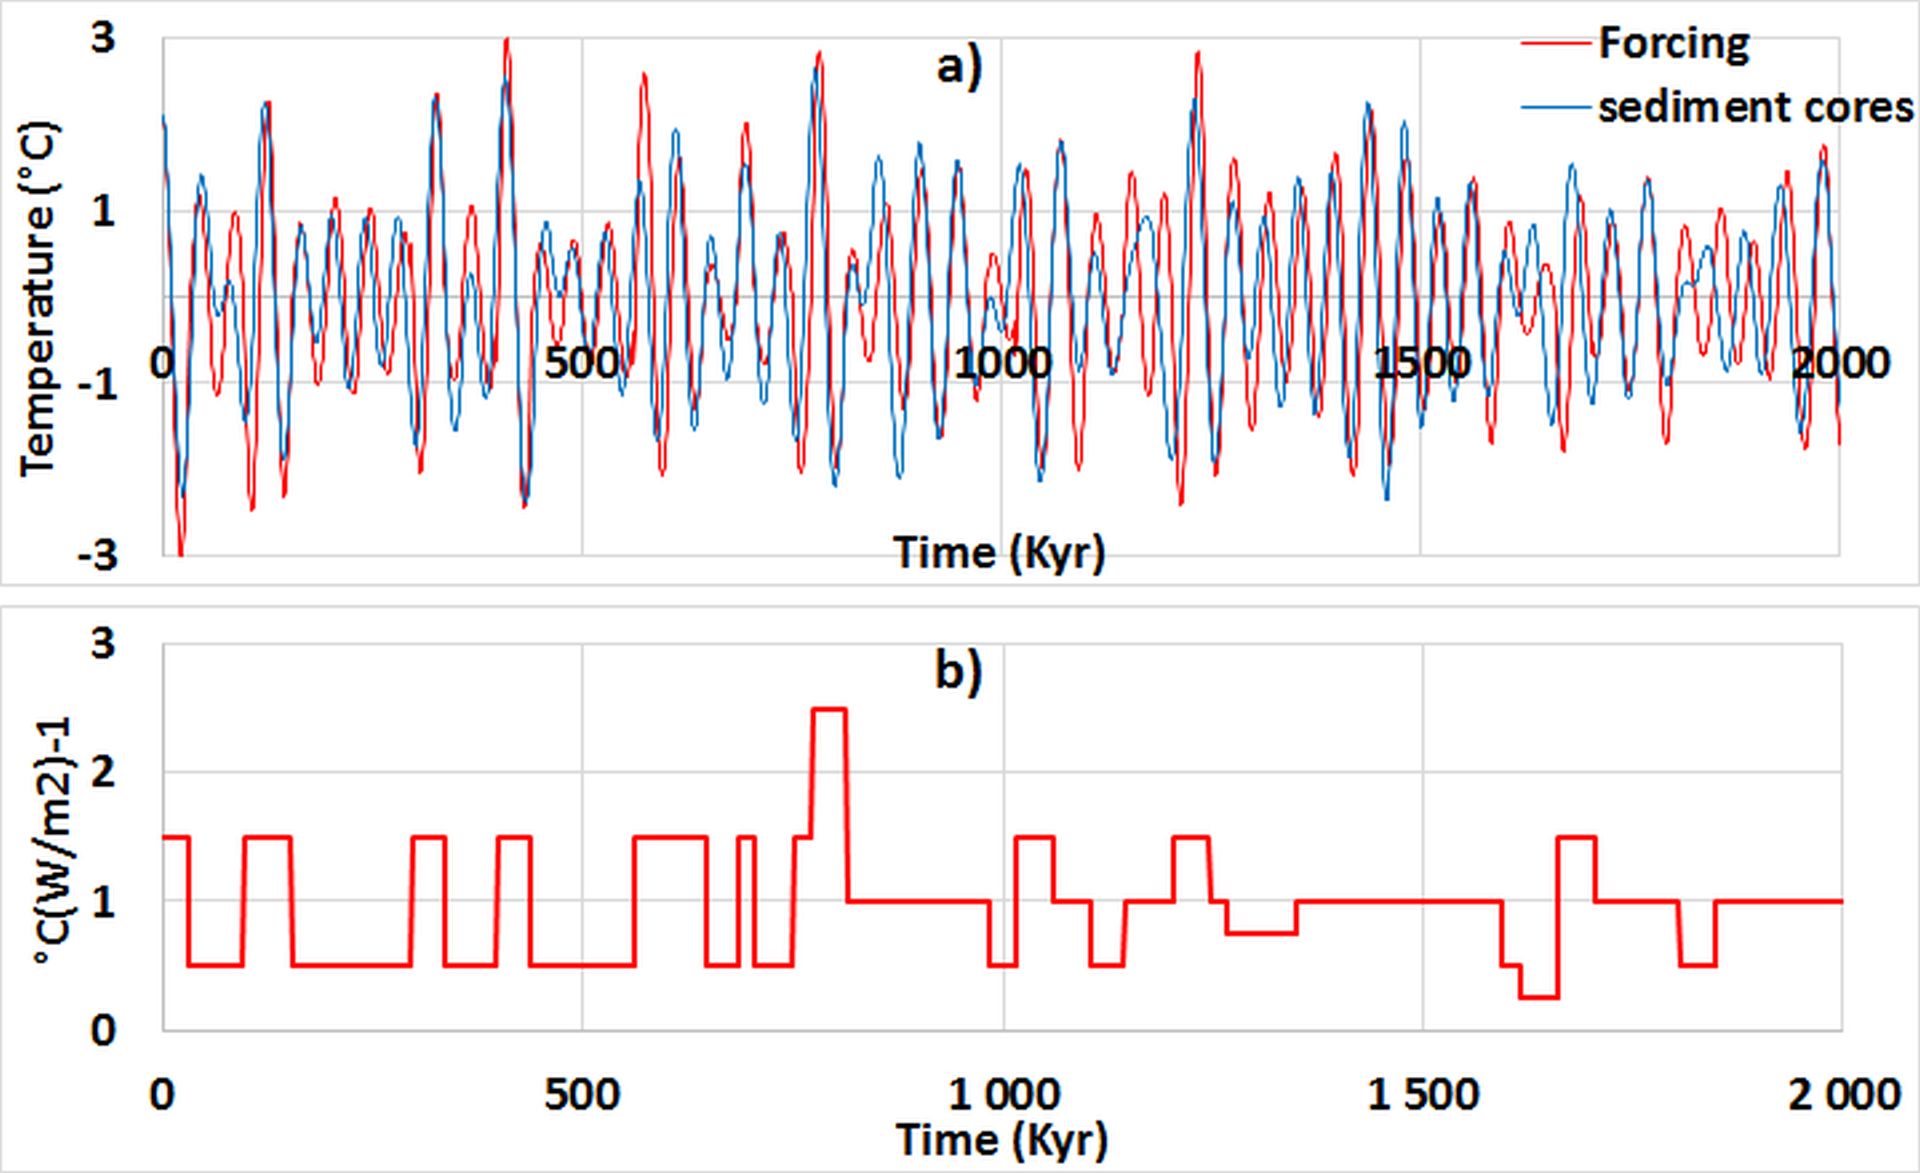
As concerns obliquity, the mean efficiency of forcing does not change significantly over the time interval considered, around 1 °C(W/m2)-1, but the stability of the coupling is better before 0.8 Myr BP, the efficiency remaining close to 1 °C(W/m2)-1 during half of the time while it oscillates between 0.5 and 1.5 °C(W/m2)-1 between 0.8 Myr BP and present. This seems to confirm that these instabilities result from coupling between the sub-harmonic and the fundamental wave, leaps decreasing when the amplitude of the fundamental wave increases. It should be noted a significant increase in forcing efficiency 0.8 Myr ago, i.e. when the sub-harmonic and the fundamental wave have nearly the same amplitude, which suggests that both gyral Rossby waves merge. On the other hand, the mean forcing efficiency related to obliquity remains low in comparison with that of eccentricity, due to the deviation between the forcing period and the natural period, which explains the transition observed 0.8 Myr BP.
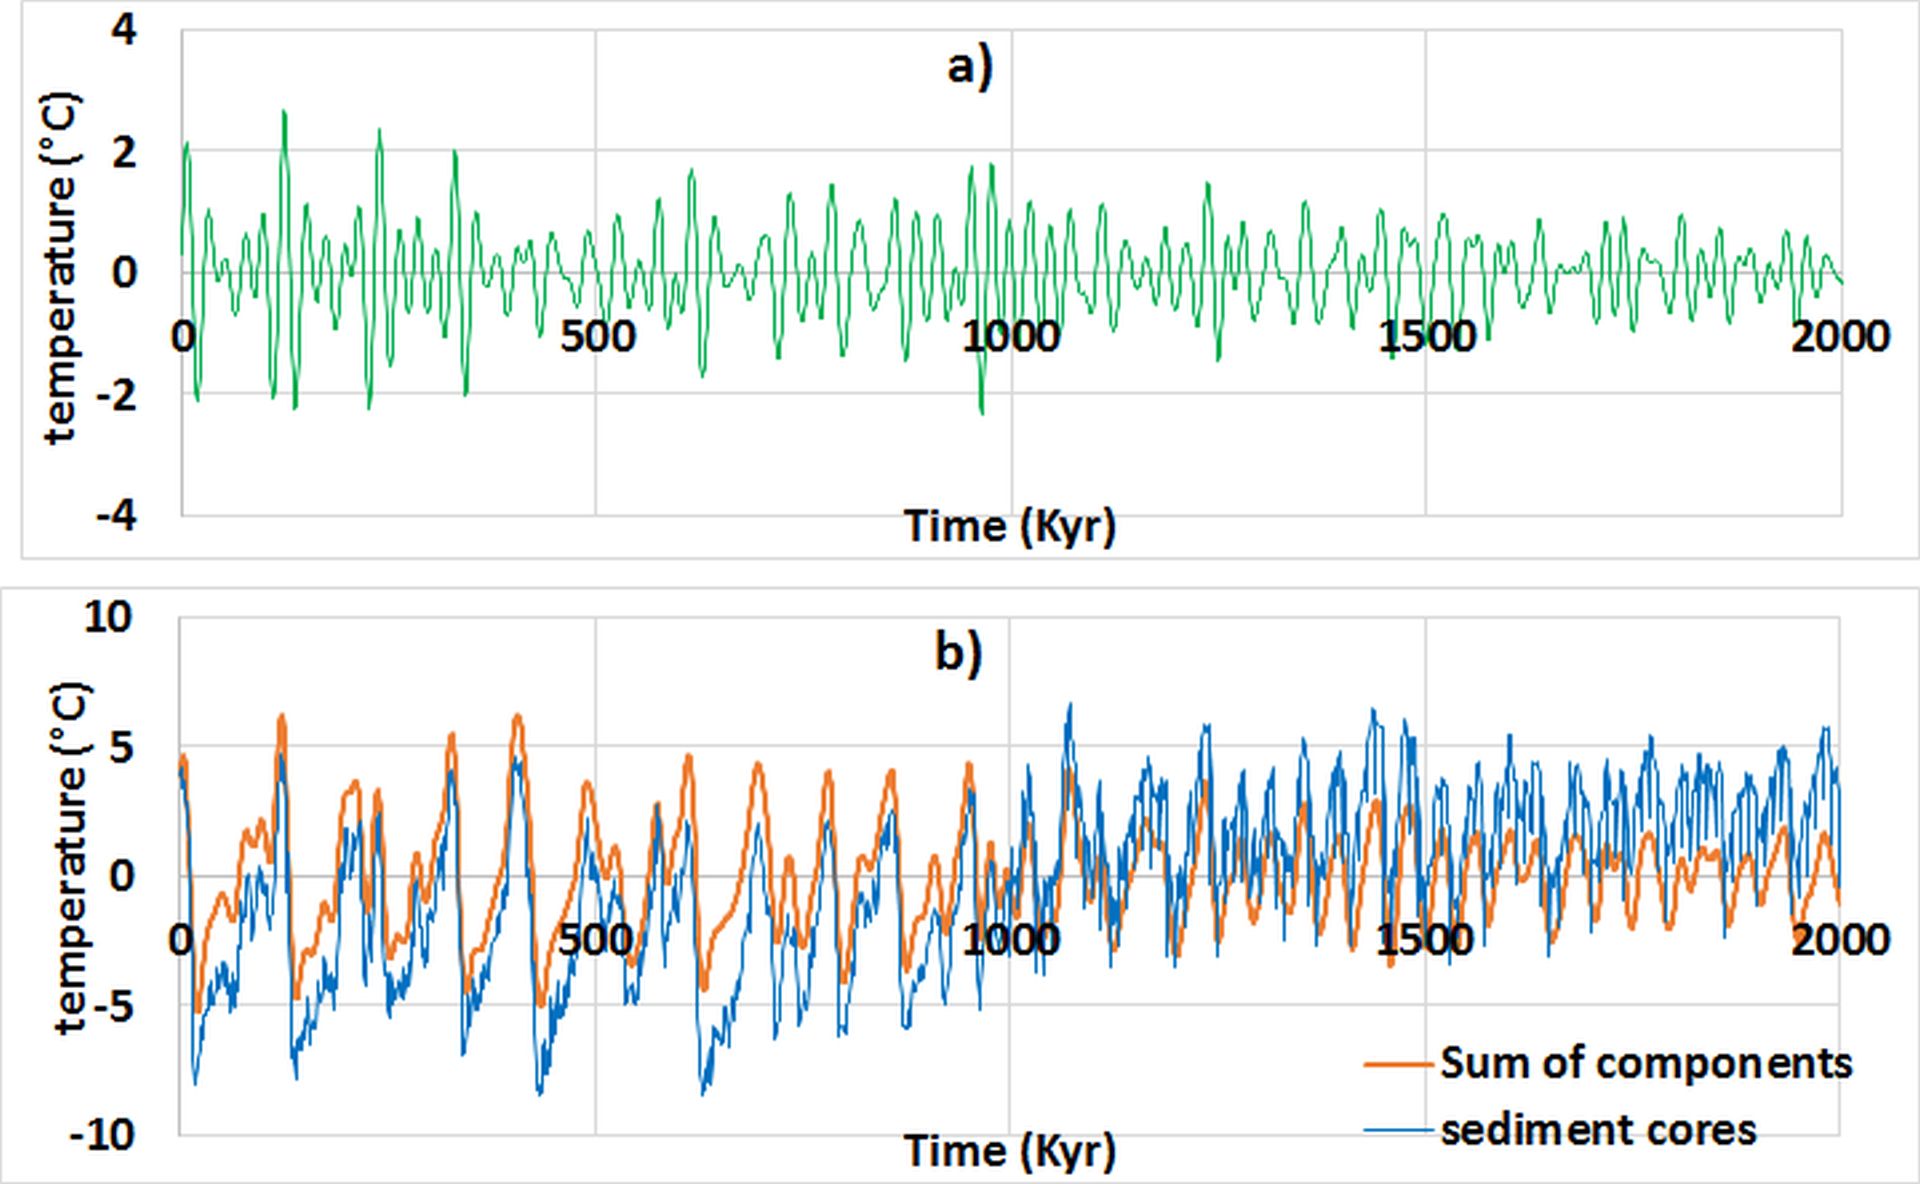
Here again, the orbital forcing related to the precession is subject to strong variations in amplitude, in relation with the phase of the fundamental wave: the sum of the three components of 23.5, 41 and 100 Kyr average periods explains quite well the global mean temperature during the glacial-interglacial period covering 2 Myr of observation if the trend is ignored. This trend is probably due to the measurement itself because it does not appear in ice core records.
The last glaciation
Proxies of global mean temperature obtained from NGRIP [North Greenland Ice Core Project members, 2004] and EPICA ice cores allows to decrypt the various forcing processes during the last glaciation. The forward motion of the polar pack in both hemispheres increases the efficiency of forcing on the gyral resonance due to the steep temperature gradient of the mixed layer between the high and low latitudes of the gyres. The comparison of the different components in successive frequency bands highlights solar and orbital forcing on gyral Rossby waves, and the coupling of harmonics between them.
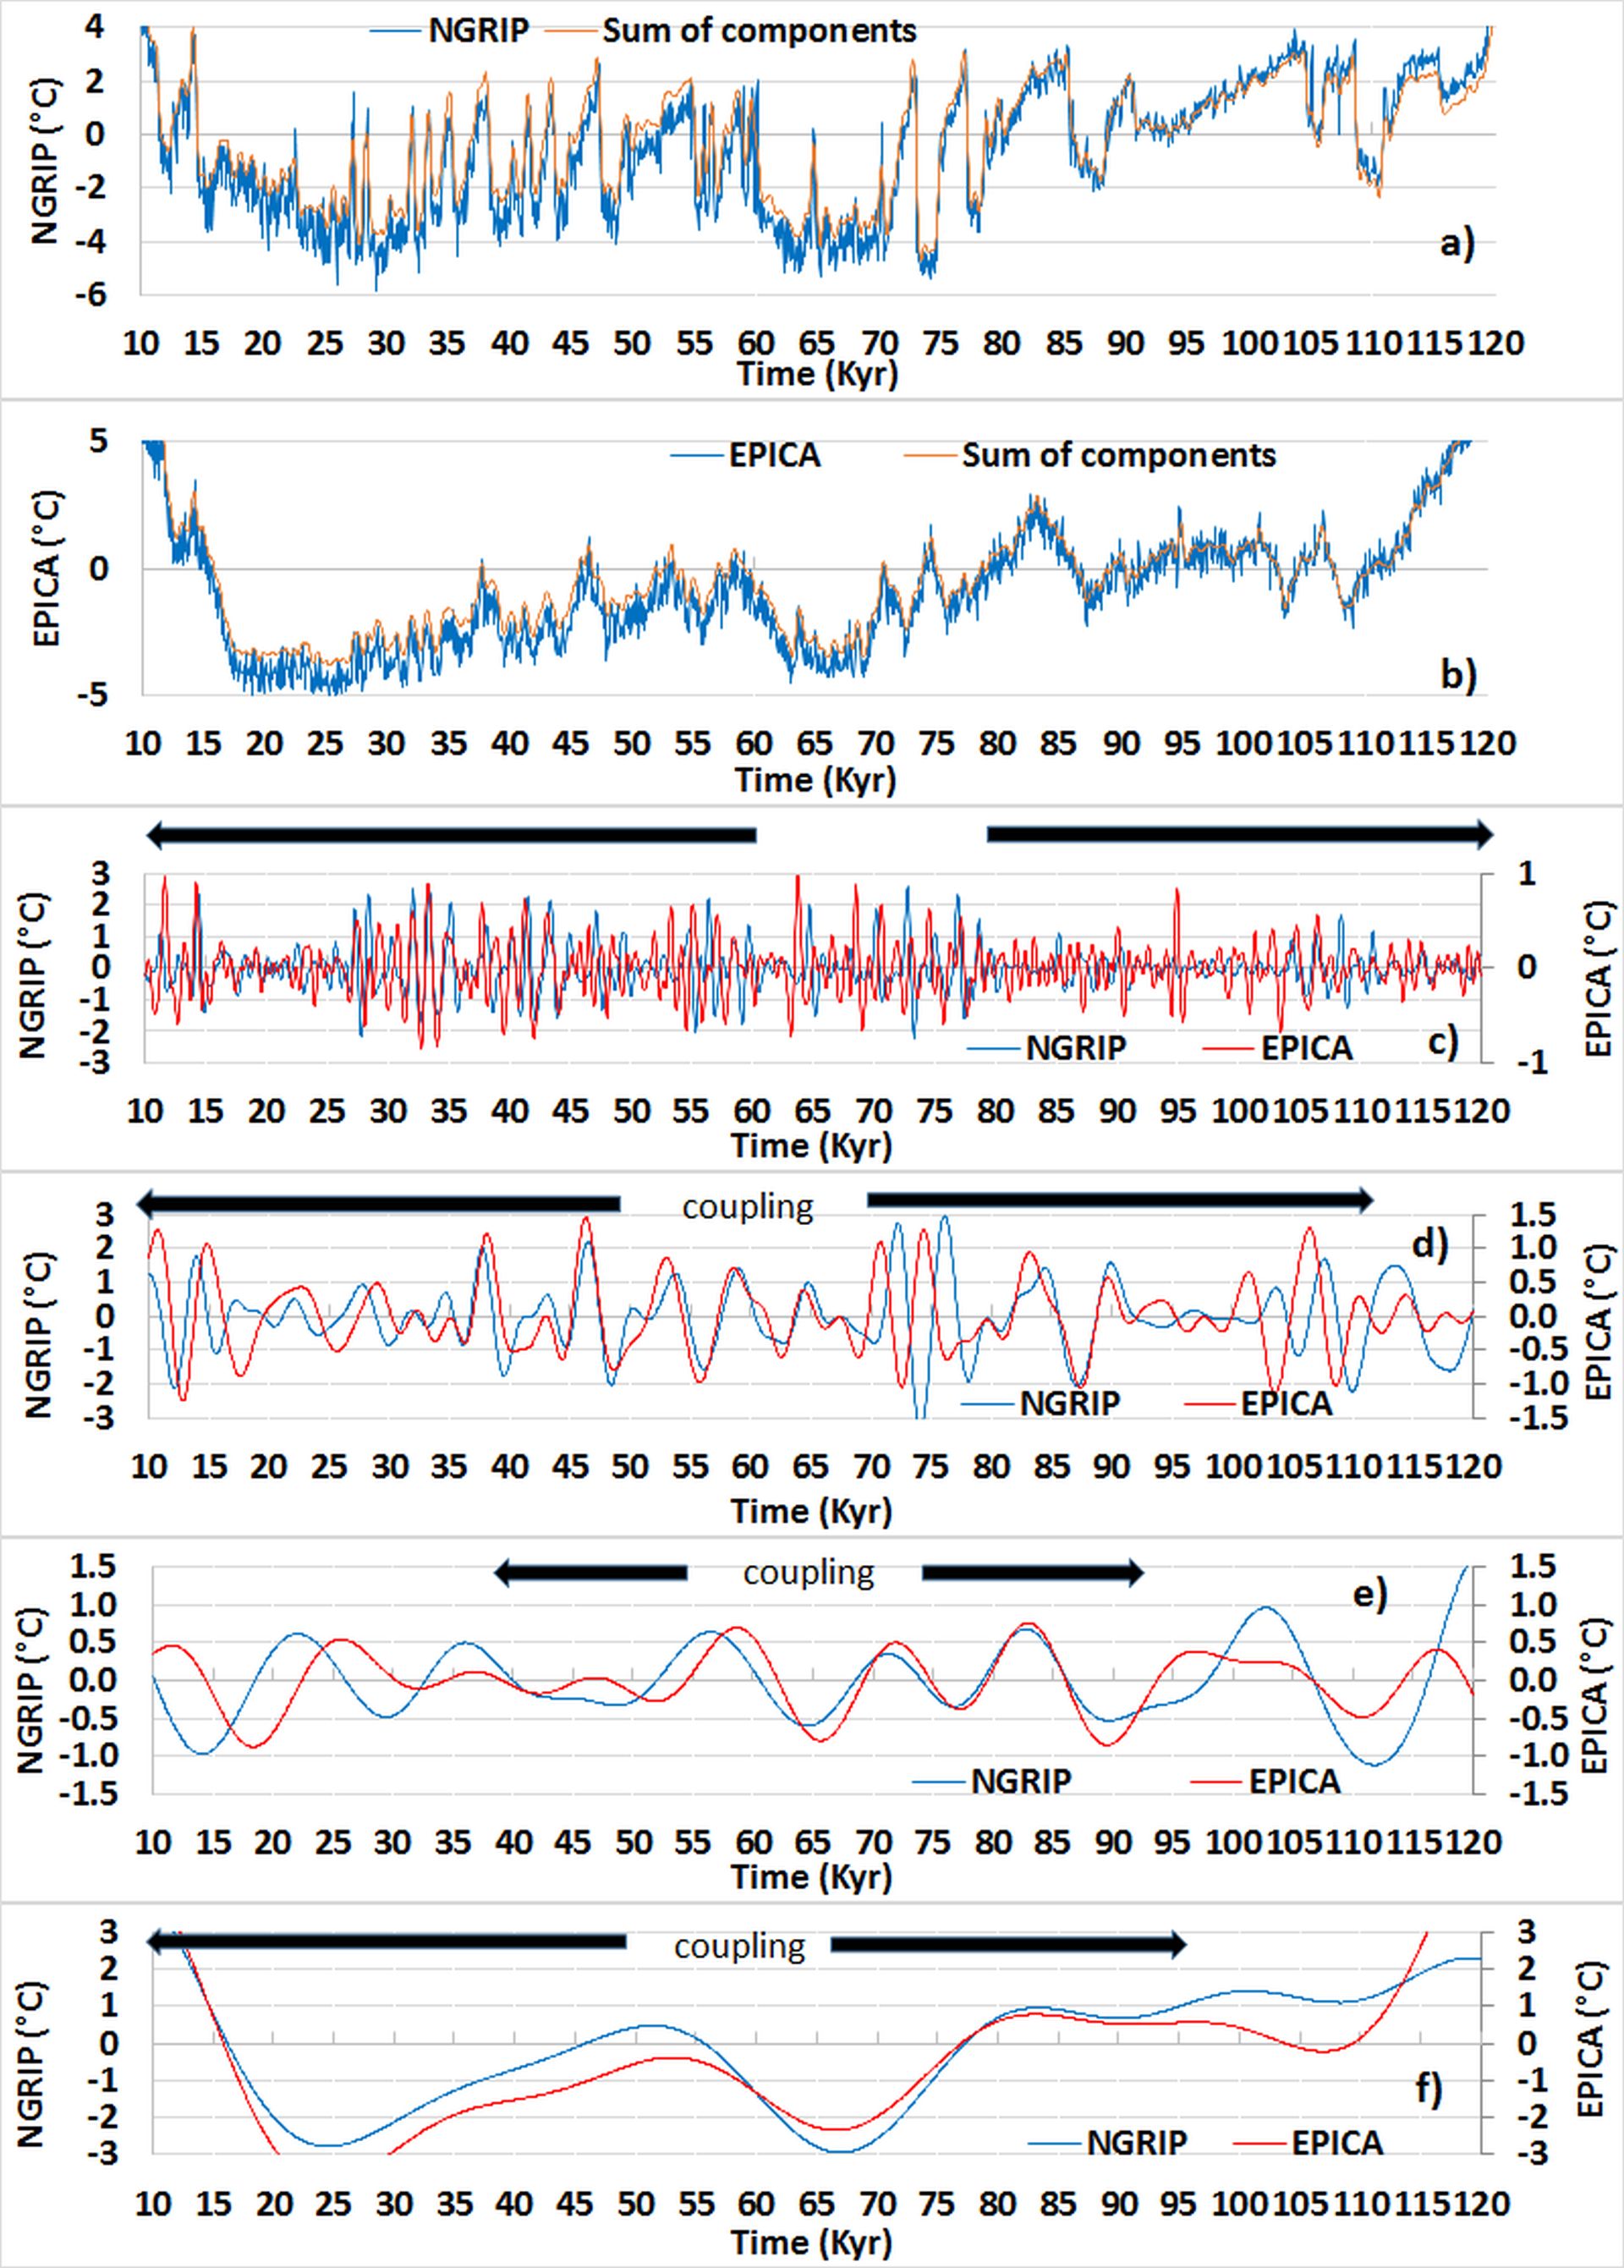
The whole band 0.58-147.5 Kyr that is required to reconstruct the gross signal accurately is divided into four bands 0.58-2.3 Kyr, 2.3-9.2 Kyr, 9.2-18.4 Kyr and 18.4-147,5 Kyr. For every band the components obtained from NGRIP and EPICA ice cores are compared: where the components are correlated, it can be inferred that a common external forcing mode occurs in both hemispheres, which is the oscillation of solar irradiance for the first three bands, and of orbital forcing for the last one. The response of gyral Rossby waves to forcing may be chaotic when the band of forcing is narrow due to the drift of the latitude of the centroid of the gyral Rossby wave that allows it to be tuned. In contrast the amplitude directly reflects the forcing efficiency when the band is broad. It is probably the reason why a good correlation is observed within the first two bands subject to solar irradiance forcing during almost the whole interval of observation.
The band 0.58-2.3 Kyr
The band 0.58-2.3 Kyr, which is the merging of the two bands 0.58-1.15 and 1.15-2.3 Kyr, discloses the forcing efficiency is three times lower in the south hemisphere than in the north Atlantic, but successive times of crisis and calm coincide in both hemispheres. Most disagreements are only apparent, due to some discrepancies on dating between both ice core records, especially between 112 and 100 Kyr, then 80 and 65 Kyr. This suggests the polar front is more advanced in the North Atlantic than in the Antarctica during warming periods, which is not true during the Holocene. This is not surprising in view the advance of the Greenland in the North Atlantic which promotes the formation of the polar pack during glaciations.
Three periods of calm can be identified, between 103 and 80 Kyr BP, 70 and 62 Kyr BP with the exception of a high amplitude event 64 Kyr BP, and between 27 and 16 Kyr BP. These intervals generally correspond to a cooling due to the reduced activity of the gyre, unless the orbital forcing prevails as occurs in the Arctic between 27 and 16 Kyr BP.
On the other hand, events of high amplitude induce a sudden warming as occurs between 80 and 70 Kyr and between 60 and 27 Kyr BP, provoking the Heinrich events and the D-O cycles: the amplitude of warming may exceed 4°C during a few hundred years in the North Atlantic. The broad correlation in both hemispheres goes against the hypothesis of internal forcing, e.g. the « binge-purge » model, to explain both Heinrich and D-O events, but argues in favor of external forcing as already mentioned by Bond et al., 1992, 1997.
The band 2.3-9.2 Kyr
The band 2.3-9.2 Kyr, which is the merging of the two bands 2.3-4.6 and 4.6-9.2 Kyr, shows a good correlation between both global mean temperatures although the EPICA component is twice as low as the NGRIP’s. Gyral resonance that occurs in this band may produce a warming of more than 2°C lasting nearly 2-3 Kyr.
The bands 9.2-18.4 and 18.4-147.5 Kyr
The coupling occurs in a narrower interval regarding the band 9.2-18.4 Kyr, i.e. between 90 and 40 Kyr BP, which suggests forcing is less efficient, and a predominance of the harmonic mode locking outside this interval. As for the band 18.4-147.5 Kyr, the amplitude of variation of the global mean temperature is the same in both hemispheres. Thus, the difference in forcing efficiency between the two hemispheres fades gradually as the period lengthens. This confirms that the response of the Polar Front to warming reflected by the shifting of its latitudinal position is slower in the North Atlantic than in the Antarctica, due to the protrusion of the Greenland that keeps cold the ocean offshore. This difference disappears when the period increases because the effects related to the extension of the polar caps are smoothed over large intervals of time.
Glacial-interglacial era
The Mid-Pleistocene Transition (MPT)
While most climate transitions have been recognized as resulting from solar and orbital forcing due to their synchronism, understanding the underlying physical mechanisms is encountering considerable problems. Changes in the forcing are too small to explain the observed climate variations as simple linear responses. Difficulties reach their culmination when the Mid-Pleistocene Transition (MPT) is considered, that is a fundamental change in the behavior of glacial cycles during the Quaternary glaciations. The transition happened approximately 1.2 million years ago, in the Pleistocene epoch. Before the MPT, the glacial cycles were dominated by a 41,000-year periodicity coherent with the Milankovitch forcing from axial tilt. After the MPT the cycle durations have increased, with an average length of approximately 100,000 years coherent with the Milankovitch forcing from eccentricity. However, the intensity of the forcing resulting from the eccentricity is much lower than that induced by the axial tilt.
The period of eccentricity varies greatly over the last 4 million years, approaching the period of resonance of the subharmonic mode n11, namely 98.3 Ka, since 1.2 Ma BP (Pinault, 2021a). The forcing efficiency related to that period has been increasing steadily since 1.4 Ma BP to reach 5°C (W/m2)-1 at present, which suggests that the tuning is still improving.
A natural period of the GRWs becoming close to the forcing period, the gyres adjust to perfect the tuning between both periods. While the dominant period of the glacial-interglacial cycles before the MPT was 41 Ka, coherent with the obliquity, it has since been coherent with that of eccentricity although the amplitude of the orbital forcing is much higher for the obliquity than for the eccentricity.
The assumption that the GRWs were tuned to different forcing periods before and after the MPT assumes that the dominant period was 41 Ka before the MPT, as attested by the climate records. However, the closest natural period corresponds to the subharmonic mode n10, namely 49.2 Ka. The transition of the period from 41 Ka, when the subharmonic mode n10 was tuned to the forcing period before the MPT, to the natural period of 49.2 Ka at present had required an adjustment of the gyre (Pinault 2021a).
The Pliocene-Pleistocene Transition
Taking advantage of the alkenone (degradation product of chlorophyl) paleothermometer in sediment cores sampled in the Tasman Sea floor, we will show that, in the same way as during the Mid-Pleistocene Transition (MPT), but with periods 10 times longer, a transition occurred at the hinge of Pliocene-Pleistocene. Both transitions will be interpreted as the response to orbital forcing of the climate system with the mediation of Gyral Rossby Waves (Pinault 2021a).
The band 295-590 Kyr
Comparison of TSI and de-trended SST filtered into the band 295-590 Kyr characteristic of the subharmonic mode n13 confirms that they are coherent because they are nearly in phase, a prerequisite for supporting a causal relationship between forcing and its presumed effects on subtropical ocean gyres. However, the forcing efficiency varies over time since the oscillation of the SST weakens between 1.6 and 2.4 Ma BP while the forcing remains sustained throughout the observation period. Indeed, Figure b) confirms the weakening of the forcing efficiency despite the vicinity of forcing and natural periods, that is, 408 and 393.2 Kyr.
The band 590-1769 Kyr
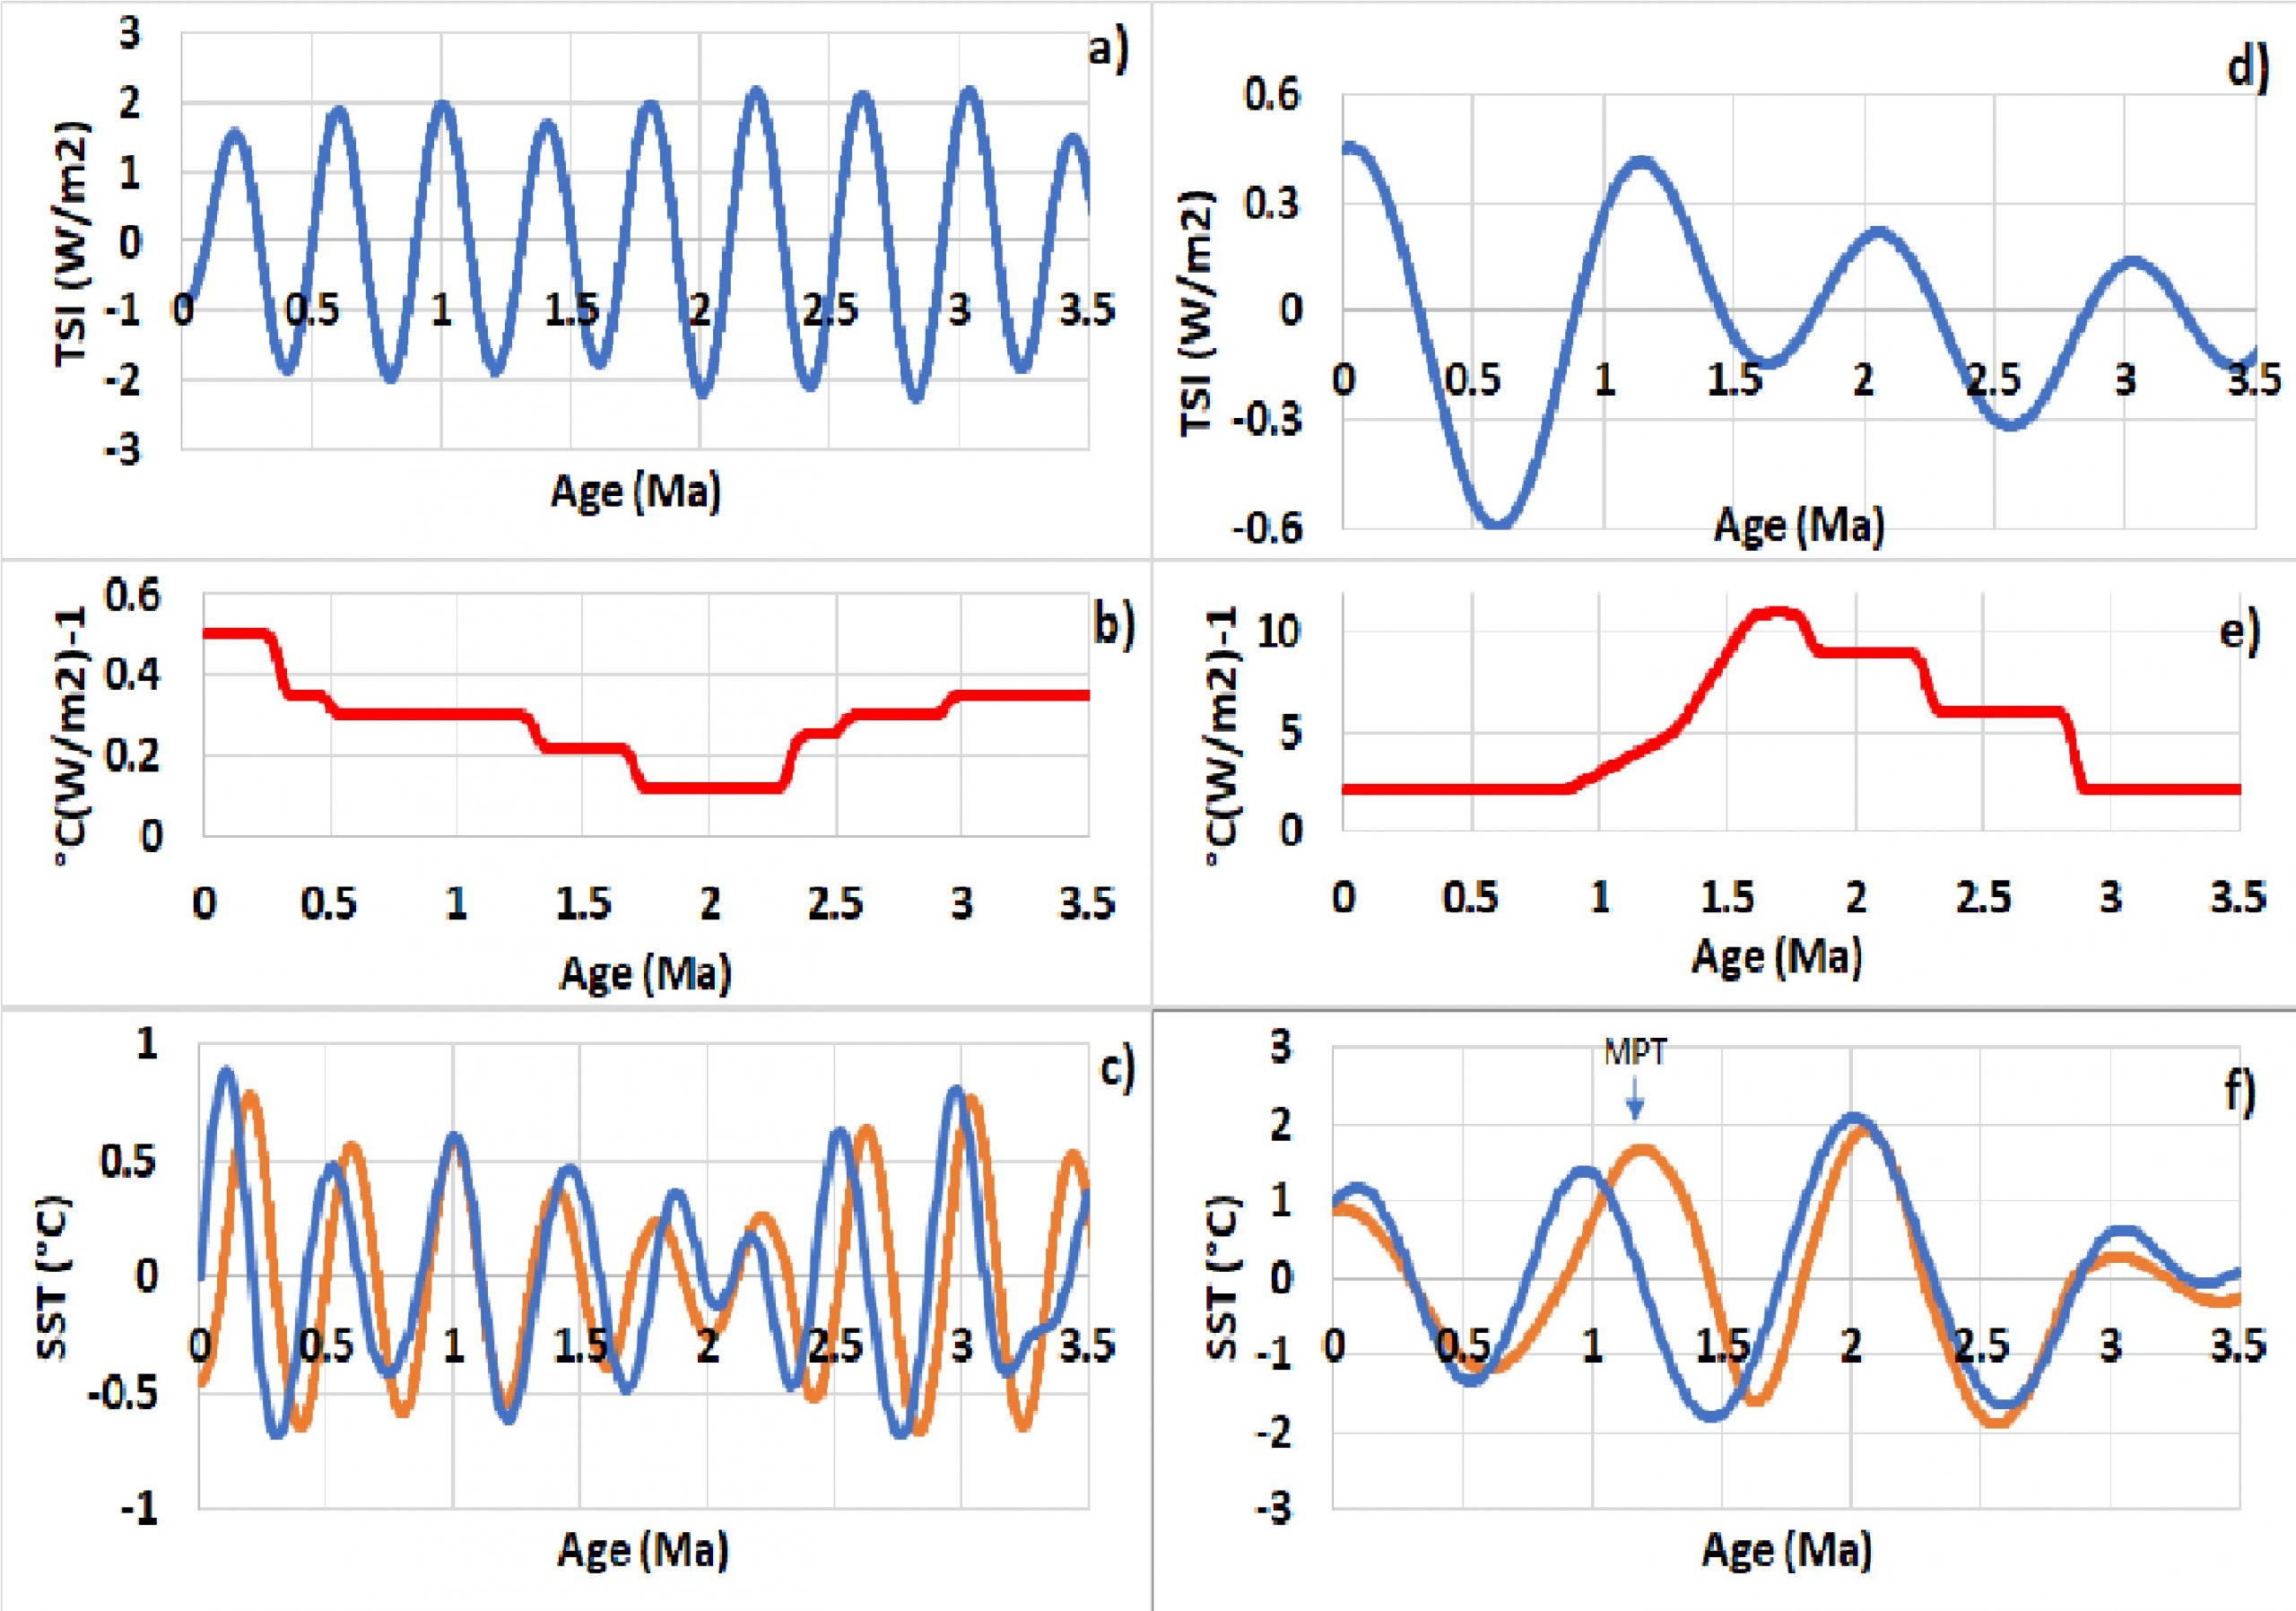
As in the band 295-590 Kyr, comparison of TSI and de-trended SST filtered into the band 590-1769 Kyr characteristic of the subharmonic mode n14 shows that they are nearly coherent, apart from the small phase shift which occurred between 1.5 and 0.8 Ma BP. This might reflect the adjustment of the gyre during the MPT: Figure f). As shown in Figure e) the forcing efficiency increases considerably during the transition Pliocene-Pleistocene, overreaching 10 °C (W / m2) -1. Such a value denotes an optimum tuning between the natural and the forcing periods. The mode n13 is multiplied by 3 to obtain the mode n14 instead of 2: this reflects the strong influence of the forcing resulting from the eccentricity variations.
The Mid-Pleistocene and Pliocene-Pleistocene Transitions (Pinault, 2021a)
Whether it is Mid-Pleistocene or Pliocene-Pleistocene transition, two subharmonic modes are forced simultaneously. They are n10 and n11 whose natural periods are 49.2 and 98.3 Ka during the first transition, and n13 and n14 whose natural periods are 0.39 and 1.18 Ma during the second. The natural period of the highest mode tunes transiently, but optimally, to the forcing period when both become very close. Then, the two subharmonic modes swap the dominant mode, as attested by the nearly symmetrical opposite variation in the forcing efficiencies (b, e). The forcing efficiency of the higher mode exceeds 10 °C (W/m2)-1 between 2.4 and 1.6 Ma BP when the tuning is optimal whereas that of the lower mode drops to 0.12 °C (W/m2)-1. The change in the dominant period occurred approximately 2.2 Ma ago when the 0.39 Ma period oscillation collapsed in favor of the 1.18 Ma period oscillation (c, f). Nowadays the transition is occurring in the other direction since the 1.18 Ma period oscillation is collapsing in favor of the 0.39 Ma period oscillation, both having approximately the same amplitude. This transition involves a weak adjustment in the circumference of the gyre because the deviation between the forcing and natural periods of the lower subharmonic mode is small, 0.41 and 0.39 Ma, respectively.
Reference
Berger, A.; Loutre, M.-F. Insolation values for the climate of the last 10 million years. Quat. Sci. Rev. 1991, 10, 297–317.
Glossary
Heinrich events, first described by marine geologist Hartmut Heinrich, occurred during the last glacial period. During such events, numerous icebergs broke off from glaciers and traversed the North Atlantic. The icebergs contained rock mass eroded by the glaciers, and as they melted, this matter was dropped onto the sea floor as « ice rafted debris ».
Dansgaard–Oeschger events (often abbreviated D–O events) are rapid climate fluctuations that occurred during the last glacial period.
The fundamental quasi-stationary wave is in phase with forcing. In sound pipes, strings and vibrating membranes form harmonics whose period is a divisor of that of the fundamental wave. As regards the long ocean waves, sub-harmonics are formed whose period is a multiple of that of the fundamental wave as occurs for high rank baroclinic modes.